Distribution card
The distribution card displays the values of multiple entities as a segmented bar. Each entity is shown as a colored segment and listed in a legend below the bar.
Use this card to compare the current values of related entities, for example power sensors from different sources or loads.
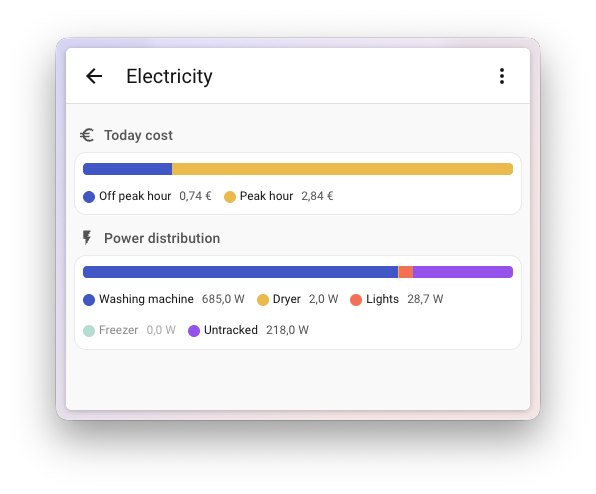 Screenshot of the distribution card.
Selecting a segment in the bar opens the more-info dialog for that entity. You can also select legend items to hide or show individual segments.
Adding the distribution card to a dashboard
- In the top right of the screen, select the edit
button. - If this is your first time editing a dashboard, the Edit dashboard dialog appears.
- By editing the dashboard, you are taking over control of this dashboard.
- This means that it is no longer automatically updated when new dashboard elements become available.
- Once you’ve taken control, you can’t get this specific dashboard back to update automatically. However, you can create a new default dashboard.
- To continue, in the dialog, select the three dots
menu, then select Take control.
- If this is your first time editing a dashboard, the Edit dashboard dialog appears.
- Add a card and customize actions and features to your dashboard.
YAML configuration
The following YAML options are available when you use YAML mode or just prefer to use YAML in the code editor in the UI.
Options for entities
If you define entities as objects instead of strings, you can add more customization and configuration:
Configuration Variables
Overwrites friendly name. Can be a string, or a name configuration object. See naming documentation.
Examples
Basic example:
type: distribution
entities:
  - sensor.grid_power
  - sensor.solar_power
  - sensor.home_battery_power
With custom names and colors:
type: distribution
title: Power distribution
entities:
  - entity: sensor.grid_power
    name: Grid
    color: blue
  - entity: sensor.solar_power
    name: Solar
    color: "#ff9800"
  - entity: sensor.home_battery_power
    name: Battery
    color: "#4caf50"