History graph card
The history graph card allows you to display a graph for each of up to eight entities.
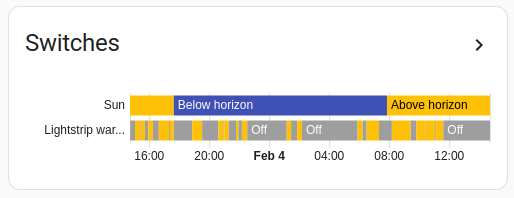 Screenshot of the history graph card, when the sensor has no `unit_of_measurement` defined.
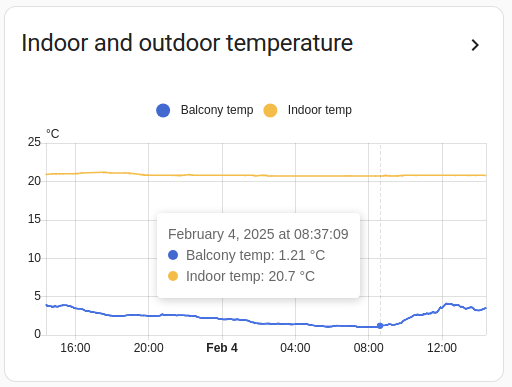 Screenshot of the history graph card, when the sensor has a `unit_of_measurement` defined.
Only the y-axis and logarithmic scale settings can be configured via the user interface. To configure the other options for this card, you need to edit the YAML configuration.
Adding the history graph card to a dashboard
- In the top right of the screen, select the edit
button. - If this is your first time editing a dashboard, the Edit dashboard dialog appears.
- By editing the dashboard, you are taking over control of this dashboard.
- This means that it is no longer automatically updated when new dashboard elements become available.
- Once you’ve taken control, you can’t get this specific dashboard back to update automatically. However, you can create a new default dashboard.
- To continue, in the dialog, select the three dots
menu, then select Take control.
- If this is your first time editing a dashboard, the Edit dashboard dialog appears.
- Add a card and customize actions and features to your dashboard.
YAML configuration
The following YAML options are available when you use YAML mode or just prefer to use YAML in the code editor in the UI.
Configuration Variables
Hours to show in graph. Minimum is 1 hour. Big values can result in delayed rendering, especially if the selected entities have a lot of state changes.
If true, numerical values on the Y-axis will be displayed with a logarithmic scale.
If true, configured Y-axis bounds would automatically extend (but not shrink) to fit the data.
Options for entities
If you define entities as objects instead of strings, you can add more customization and configuration:
Configuration Variables
Overwrites friendly name. Can be a string, or a name configuration object. See naming documentation.
Long term statistics
Home Assistant saves long-term statistics for a sensor if the entity has a state_class of measurement, total, or total_increasing. For long-term statistics, an hourly aggregate is stored from the sensor history. Long-term statistics are never purged.
In the history graph card, if the hours to show variable is set to a figure higher than the recorder retention period, long-term statistics will backfill the older parts of the history graph, with more recent actual sensor values from the recorder shown in bold.
Examples
type: history-graph
title: 'My Graph'
entities:
  - sensor.outside_temperature
  - entity: media_player.lounge_room
    name: Main player
Or with longer time frame, and multiple entities (as long as they share the same unit_of_measurement) in one graph:
type: history-graph
title: "Temperatures in the last 48 hours"
hours_to_show: 48
entities:
  - sensor.outside_temperature
  - entity: sensor.lounge_temperature
    name: "Lounge"
  - entity: sensor.attic_temperature
    name: "Attic"