Sensor card
The sensor card gives you a quick overview of a sensor’s state with an optional graph to visualize change over time.
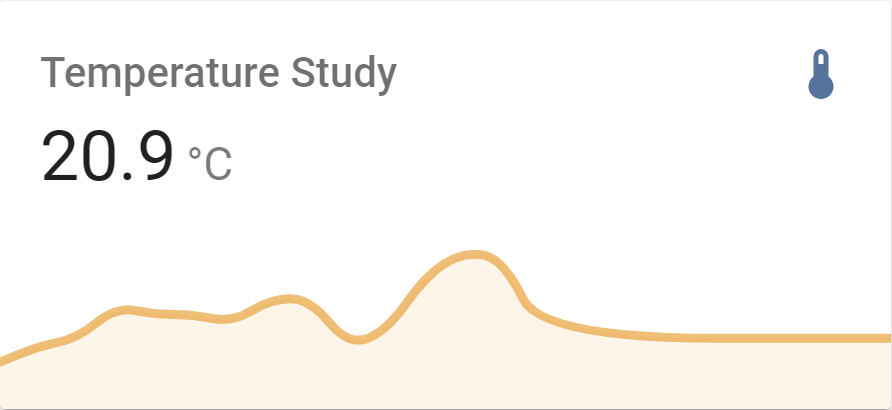 Screenshot of the sensor card.
All options for this card can be configured via the user interface.
Adding the sensor card to a dashboard
- In the top right of the screen, select the edit
button. - If this is your first time editing a dashboard, the Edit dashboard dialog appears.
- By editing the dashboard, you are taking over control of this dashboard.
- This means that it is no longer automatically updated when new dashboard elements become available.
- Once you’ve taken control, you can’t get this specific dashboard back to update automatically. However, you can create a new default dashboard.
- To continue, in the dialog, select the three dots
menu, then select Take control.
- If this is your first time editing a dashboard, the Edit dashboard dialog appears.
- Add a card and customize actions and features to your dashboard.
YAML configuration
The following YAML options are available when you use YAML mode or just prefer to use YAML in the code editor in the UI.
Configuration Variables
Overwrites friendly name. Can be a string, or a name configuration object. See naming documentation.
Detail of the graph 1 or 2 (1 = one point/hour, 2 = six points/hour).
Hours to show in graph. Minimum is 1 hour. Big values can result in delayed rendering, especially if the selected entities have a lot of state changes.
Limits of the graph Y-axis.
Override the used theme for this card with any loaded theme. For more information about themes, see the frontend documentation.
The hours_to_show option controls the time range of historical data shown in the graph. The amount of history available depends on the Recorder’s purge_keep_days setting. By default, the Recorder purges data older than 10 days. See the Recorder integration documentation for more information.
Examples
Basic sensor card:
type: sensor
entity: sensor.illumination
name: Illumination
Sensor card with historical data graph:
type: sensor
entity: sensor.my_temperature
graph: line
hours_to_show: 720 # shows 30 days of history only if history exists for this sensor