Multiple dashboards
You can define multiple dashboards in Home Assistant. Each dashboard can be added to the sidebar. This makes it possible to create separate control dashboards for each individual part of your house.
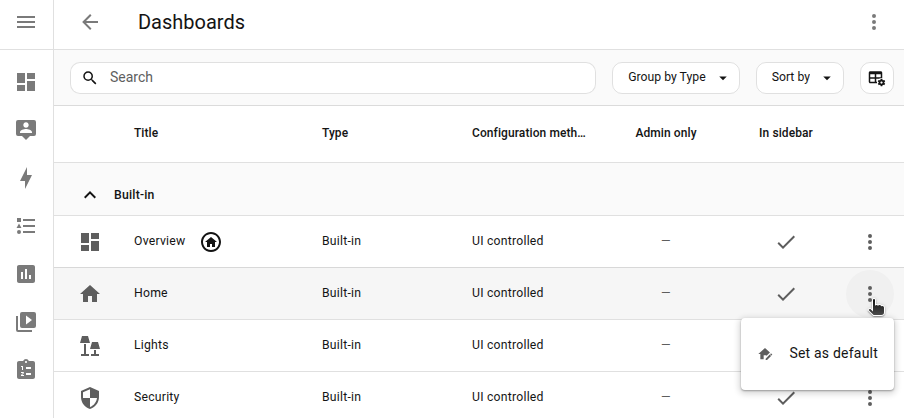
Under Settings > Dashboards, you can see your own dashboards as well as the predefined, built-in dashboards.
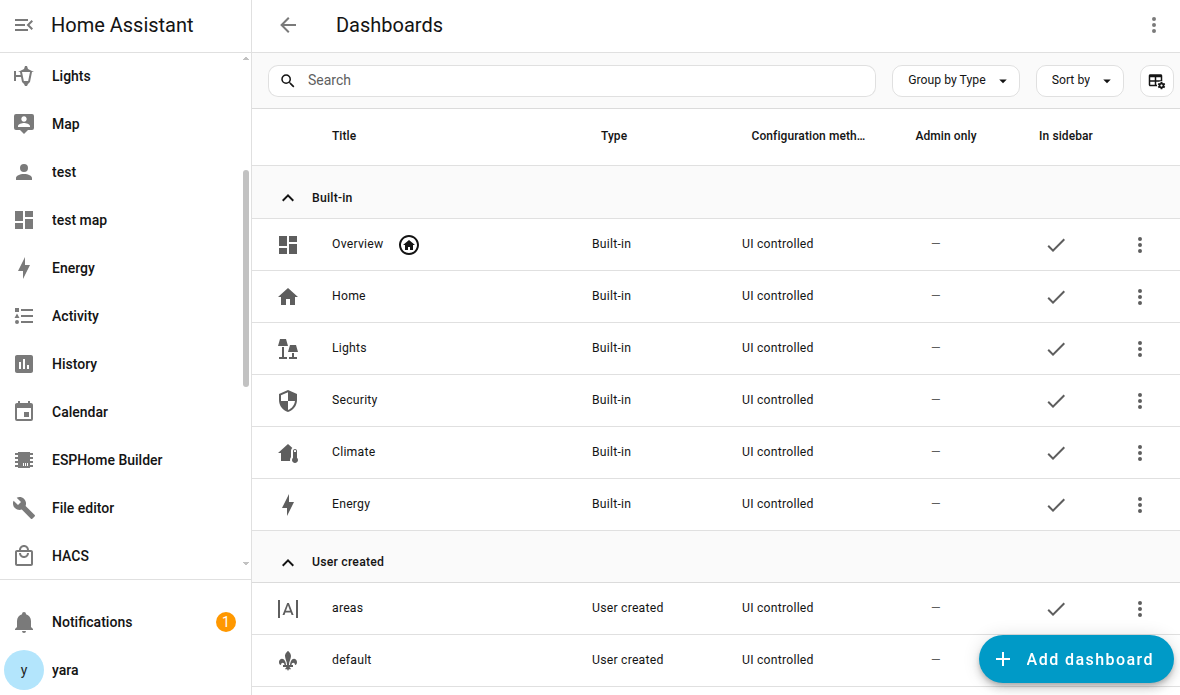 Screenshot of the Dashboard list.
Home Assistant built-in dashboards
Built-in dashboards are available out of the box, cannot be deleted, and there are limited options on how much you can edit them.
Dashboards shown in the sidebar by default
Predefined dashboards that are available in the sidebar by default:
- Home dashboard. Category: built-in. It is shown in the sidebar only while it is set as your default dashboard. If you set another dashboard as default, that dashboard appears in the sidebar instead.
- Activity dashboard. Category: built-in.
- Energy dashboard. Category: built-in.
- History dashboard. Category: built-in.
- Map dashboard. Category: User created. The Map dashboard is an exception: it is available out of the box, but you can edit it freely. This is why it is categorized as a User created dashboard.
- To-do lists dashboard. Category: built-in.
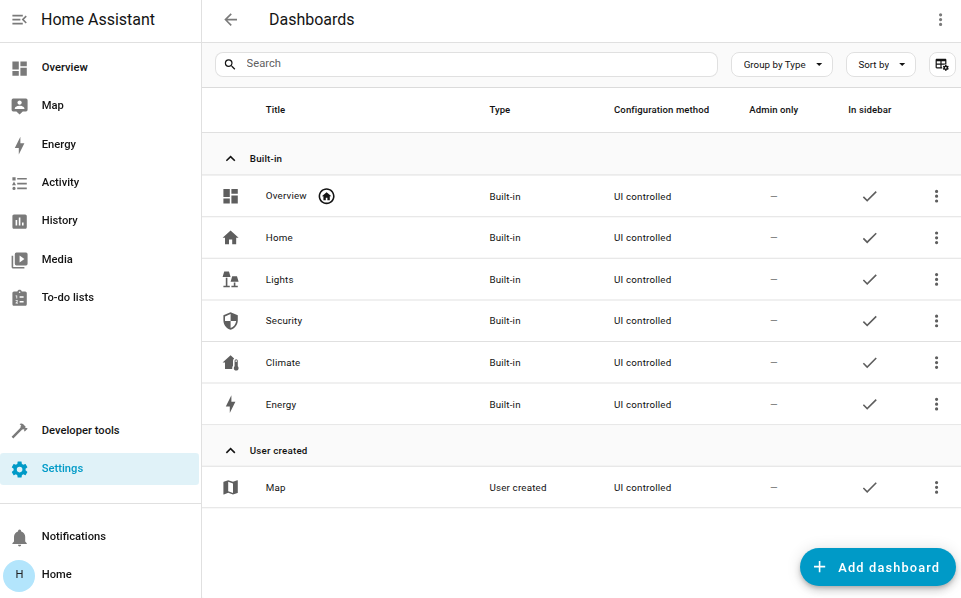 Screenshot of the Dashboard list on a new installation.
Dashboards only shown in the dashboard list by default
Some of the built-in dashboards are not shown in the sidebar by default, but are listed under Settings > Dashboards.
- Lights dashboards: Overview of your lights, grouped by floors and areas.
- Security dashboards: Overview of your security-related devices, grouped by floors and areas. The security-related devices include devices such as alarm, lock, camera, doors/covers, motion sensors, and binary sensor.
- Climate dashboards: Overview of your climate devices, grouped by floors and areas. The climate dashboard includes devices such as heating and cooling devices, windows, and fans.
- Energy dashboards: Allows you to visualize your energy consumption and production, if you have such entities available. This includes electricity from grid and from solar panels, gas and water consumption, and the status of your battery storage.
Not all of the predefined dashboards are listed under Settings > Dashboards. The Activity and History dashboards for example are powered by their respective integrations.
Home dashboard
The Home dashboard is an entry point to open other built-in dashboards based on areas or topics such as lights, climate, or media players.
The Home dashboard is prepopulated by default and shows your entitiesAn entity represents a sensor, actor, or function in Home Assistant. Entities are used to monitor physical properties or to control other entities. An entity is usually part of a device or a service. [Learn more] grouped by areas.
- It uses the sections view type and tile cards.
- The first view shows all your areas and the entitiesAn entity represents a sensor, actor, or function in Home Assistant. Entities are used to monitor physical properties or to control other entities. An entity is usually part of a device or a service. [Learn more] that are assigned to those areas.
- In addition, the dashboard provides a separate view for each area.
- EntitiesAn entity represents a sensor, actor, or function in Home Assistant. Entities are used to monitor physical properties or to control other entities. An entity is usually part of a device or a service. [Learn more], such as lights, covers, and cameras are automatically grouped by domainEach integration in Home Assistant has a unique identifier: The domain. It is often shown as the first part (before the dot) of entity IDs..
 Screenshot of the built-in Home dashboard.
Editing the Home dashboard
- Make sure all the entitiesAn entity represents a sensor, actor, or function in Home Assistant. Entities are used to monitor physical properties or to control other entities. An entity is usually part of a device or a service. [Learn more] are assigned to an area.
- In the top-right corner, select the
icon. - You can add entities to customize which items appear on your dashboard.
- If you don’t like how the cards are arranged, you can reorder floors and areas under Settings > Areas, labels & zones.
Troubleshooting: entity is not showing
- Not all devices or entity types are automatically added to the Home dashboard.
- Make sure the entity is assigned to an area and check the dashboard again.
History dashboard
The predefined History dashboard is powered by the History integration. To learn about the data sources used and how to export data, refer to the documentation of the History integration.
Activity dashboard
The predefined Activity dashboard is powered by the Activity integration. To control which events to show or filter out, refer to the documentation of the Activity integration.
Map dashboard
The predefined Map dashboard is populated by the Map card. You can edit this dashboard like any other dashboard. For example, you can edit the view to use the Sidebar instead of the default Panel view type if you like.
Maps and presence detection
If you see a person on the map, it means you have connected a device that allows presence detection. This is the case for example if you have the Home Assistant Companion App on your phone and allowed location tracking.
To-do lists dashboard
The predefined To-do lists dashboard is powered by the To-do integration. To learn how to use to-do and shopping lists, refer to the documentation of the to-do list integration.
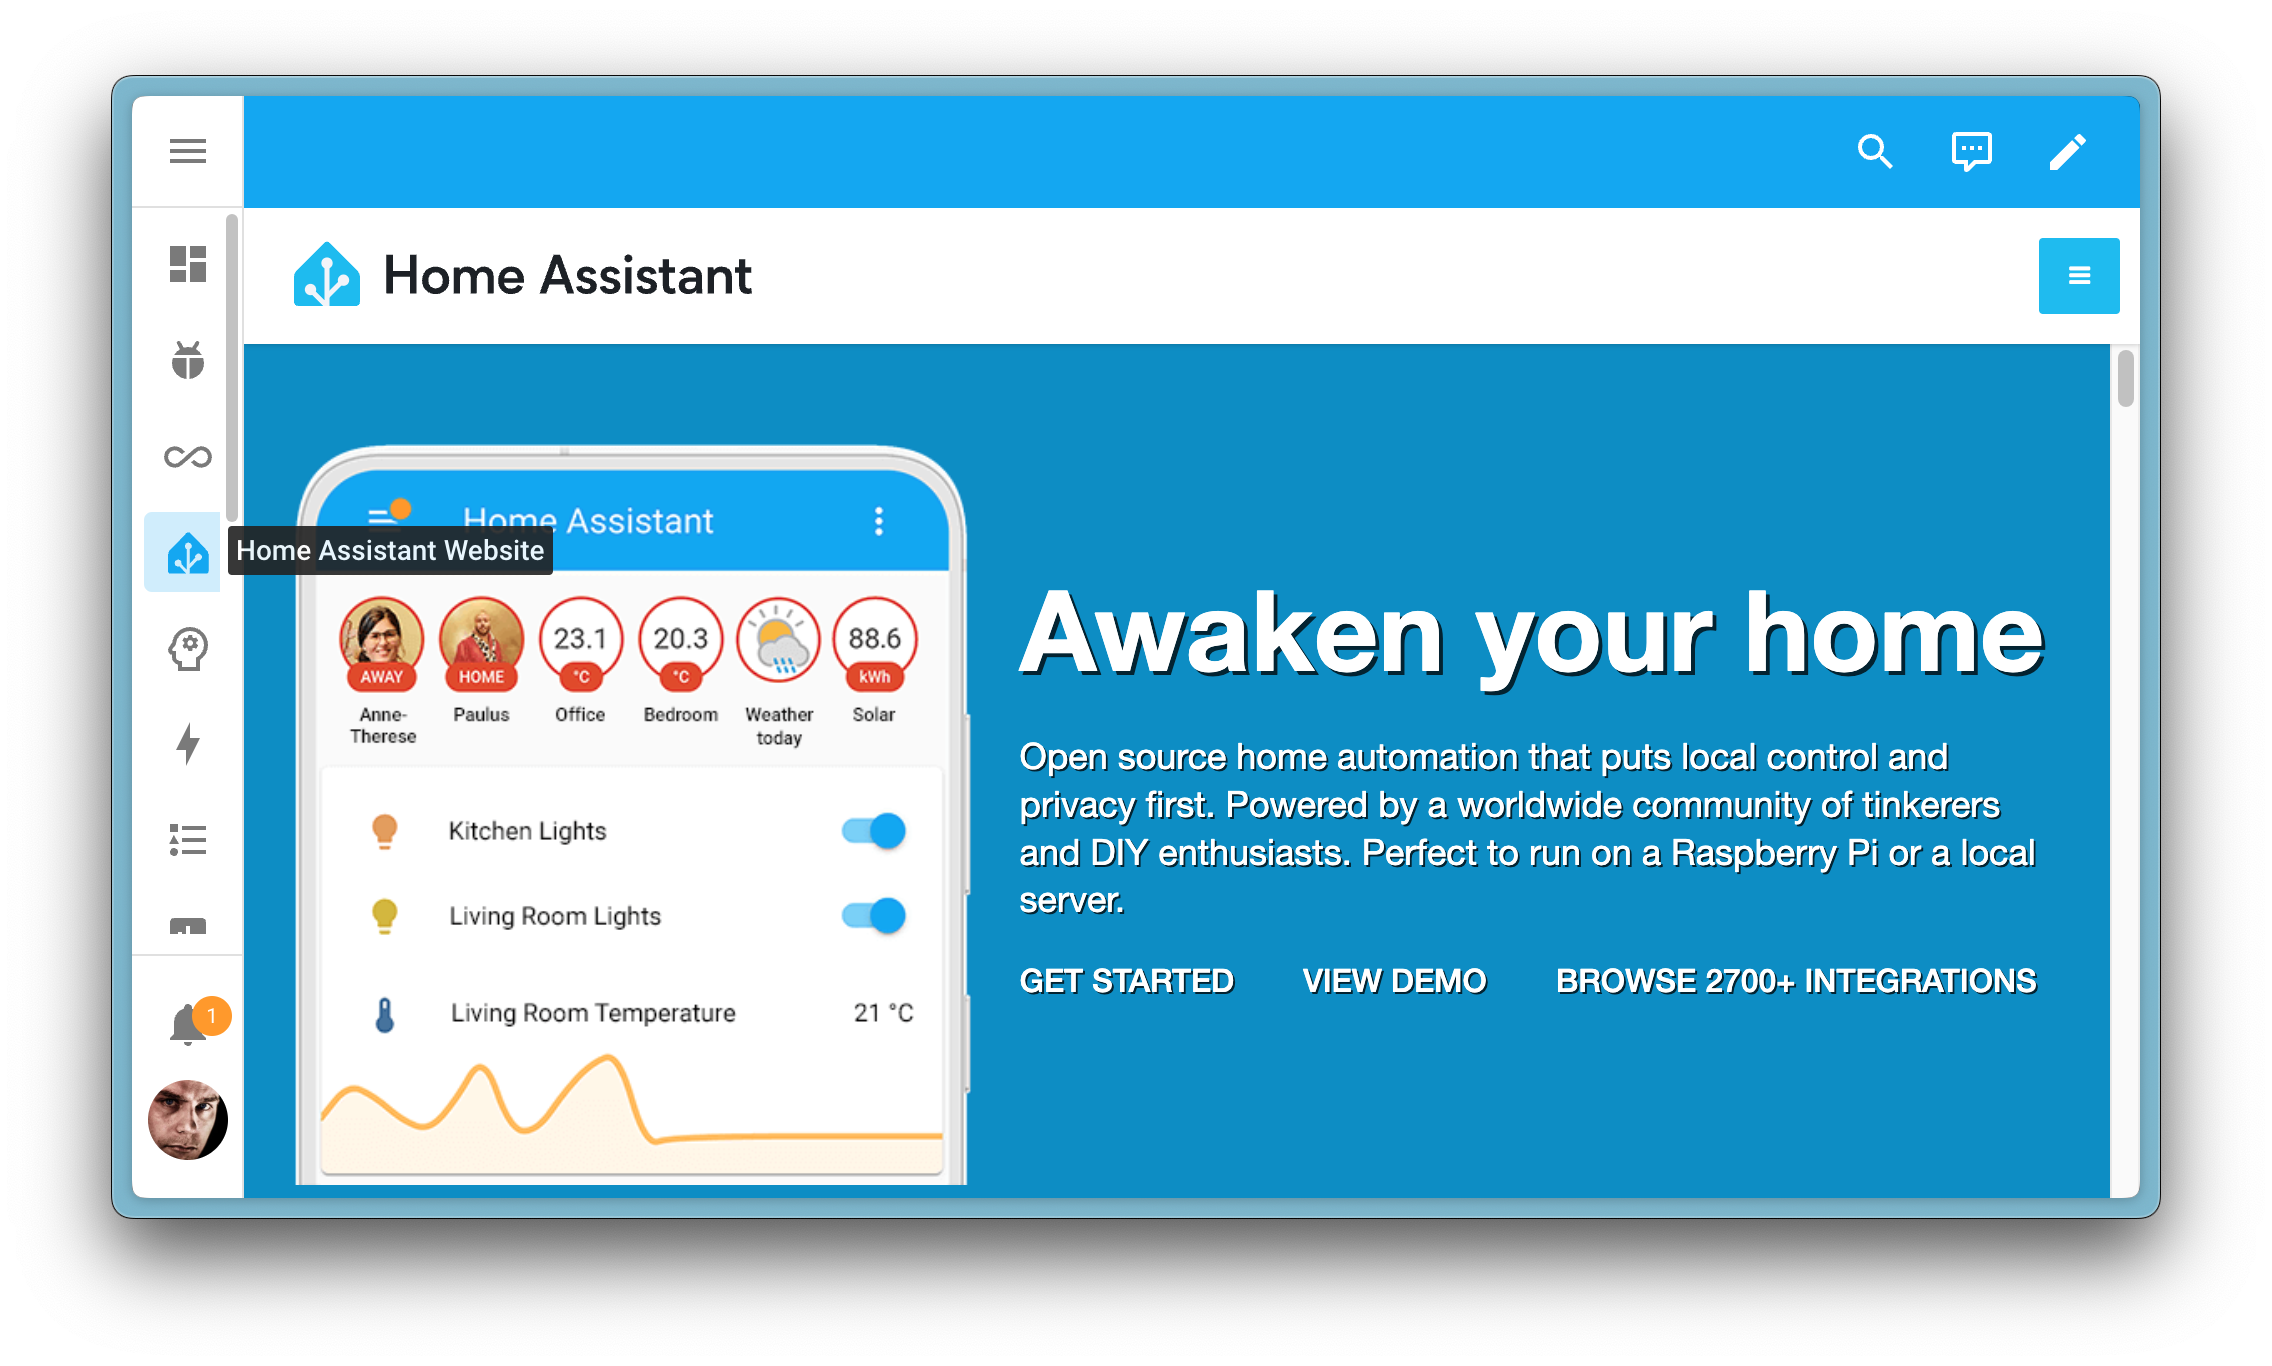
Webpage dashboard
Another available (but not default) dashboard is the webpage dashboard. The webpage dashboard allows you to add and embed a webpage to your dashboard. This could be a web page from the internet or a local web page from a local machine or device like your router or NAS. The webpage dashboard uses the webpage card.
This dashboard replaces the old iFrame panel (iframe_panel). If you have
existing panels configured in your YAML configuration, Home Assistant will
automatically migrate them to the new webpage dashboard on upgrade.
Note that not every webpage can be embedded due to security restrictions that some sites have in place. These restrictions are enforced by your browser and prevent embedding them into a Home Assistant dashboard.
Setting a default dashboard
The default dashboard is the dashboard that is shown when you open Home Assistant. It is listed on top of the sidebar.
- If you have administrator rights, you can set an initial default dashboard for all users.
-
Go to Settings > Dashboards.
-
In the list of dashboards, find the dashboard of interest and select the
menu. -
Select Set as default.
-
Result: This dashboard is shown to all users when they open Home Assistant.
-
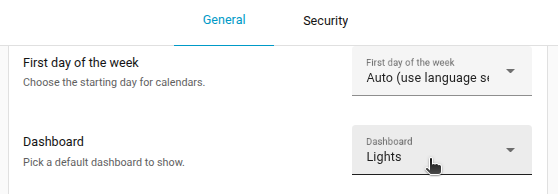
- To change your personal default dashboard, you don’t need administrator rights.
-
Go to User profile.
-
On the General tab, under Dashboard, select your default dashboard.
-
If you want your wall tablet to use a different dashboard than your other devices, use a separate user profile for your wall tablet.
- If you set your phone to one dashboard and your wall tablet to another, using the same user, they’ll both revert to the default dashboard.
-
Creating a new dashboard
The built-in dashboards update themselves when you add new devices. If you want a customized dashboard, it is recommended not to change the Overview dashboard, but to create a new dashboard instead.
This will leave the default dashboard intact.
-
Go to Settings > Dashboards.
-
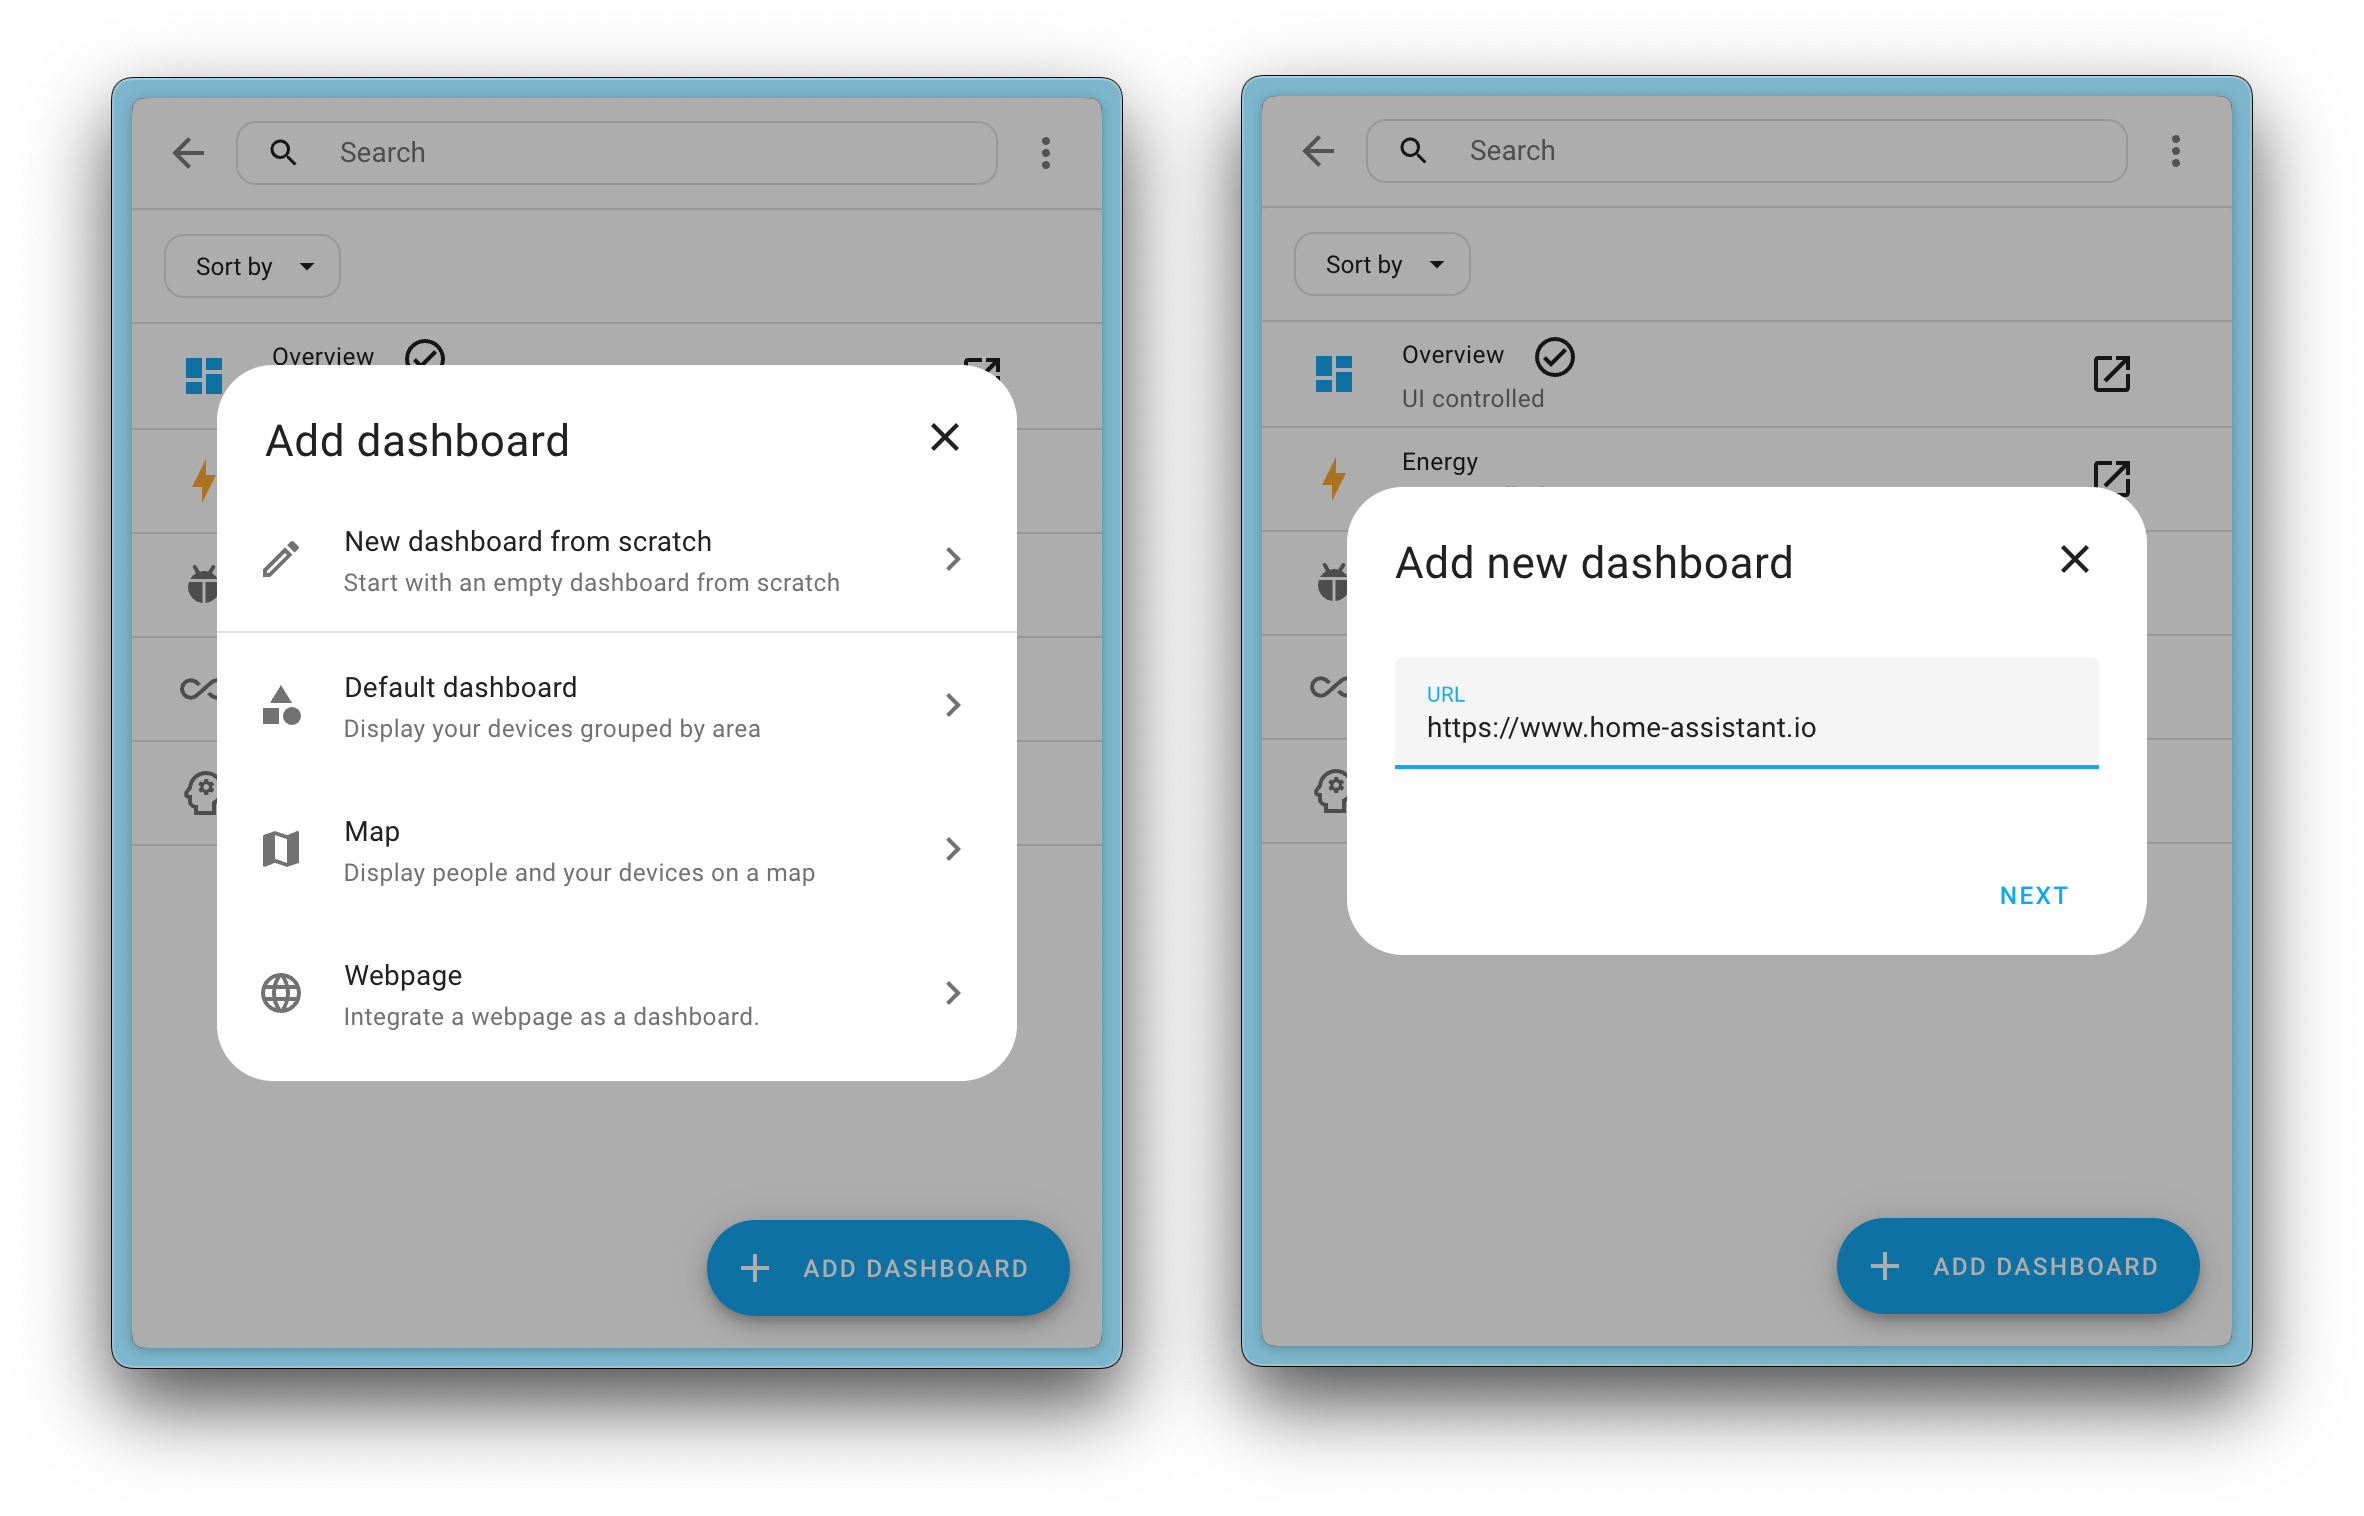
Select Add dashboard.
-
In the dialog, choose one of the options:
- If you want to start with a pre-populated dashboard, choose Overview (Legacy) or one of the suggested ones, such as the Map dashboard.
- If you want to start with a completely empty dashboard, choose New dashboard from scratch.
-
In the Add new dashboard dialog, enter a name and select an icon.
- Define if this dashboard should be visible only to the admin user.
- Define if you want the dashboard to be listed in the sidebar.
- Select Create.
- Result: The dashboard is added.
Editing a new dashboard
-
Open your new dashboard and in the top right of the screen, select the
button. - Result: The Edit dashboard dialog appears.
-
Select the areas you want to show on this new dashboard and select Save.
-
If you want to have more detailed control over the dashboard, you need to take control:
- This means that this dashboard is no longer automatically updated when new dashboard elements become available.
- Once you’ve taken control, you can’t get this specific dashboard back to update automatically. However, you can create a new default dashboard.
- To continue, in the dialog, select the three dots
menu, then select Take control.
-
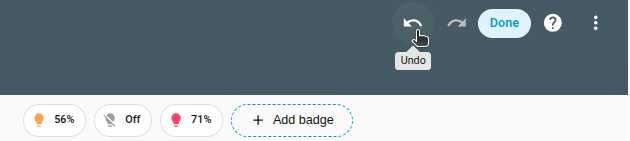
You can now add a badge, add a card, or add a view.
-
To undo or redo a change, select the buttons on top of the dashboard.
Deleting a dashboard
If you do not use one of the predefined dashboards, or created a dashboard you no longer need, you can delete that dashboard. It will then no longer show in the sidebar.
- Go to Settings > Dashboards.
- From the list of dashboards, select the dashboard you want to delete.
- In the dialog, select Delete.

Adding YAML dashboards
You can use YAML to define dashboards. Each YAML dashboard is loaded from its own YAML file. To add YAML dashboards, in your configuration.yaml file create a dashboards: section under the top-level lovelace: key.
lovelace:
  # Use resource_mode to load resources from YAML
  resource_mode: yaml
  # Include external resources (requires resource_mode: yaml)
  resources:
    - url: /local/my-custom-card.js
      type: module
    - url: /local/my-webfont.css
      type: css
  # Add YAML dashboards
  dashboards:
    my-home: # Needs to contain a hyphen (-)
      mode: yaml
      filename: my-home.yaml
      title: My home
      icon: mdi:home-outline
      show_in_sidebar: true
    dashboard-hidden:
      mode: yaml
      filename: hidden.yaml
      title: Hidden
      show_in_sidebar: false
    dashboard-admin:
      mode: yaml
      title: Admin
      icon: mdi:tools
      show_in_sidebar: true
      require_admin: true
      filename: admin.yaml
Configuration Variables
Controls how resources are loaded. Set to yaml to load resources from the resources key in YAML configuration. Set to storage to manage resources through the UI.
List of resources that should be loaded. Requires resource_mode: yaml to take effect. After changing the YAML configuration, select the three dots lovelace.reload_resources action directly.
Additional YAML dashboards. The key is used for the URL and should contain a hyphen (-), except for lovelace, which is allowed for backward compatibility.
The mode of the dashboard, this should always be yaml. Dashboards in storage mode can be created in the configuration panel.
The file in your config directory where the configuration for this panel is.
The icon to show in the sidebar. You can use any icon from Material Design Icons. Prefix the icon name with mdi:, ie mdi:home.
As a super minimal example of a dashboard config, here’s the bare minimum you will need for it to work:
views:
    # View tab title.
  - title: Example
    cards:
        # The markdown card will render markdown text.
      - type: markdown
        title: Dashboard
        content: >
          Welcome to your **dashboard**.
A slightly more advanced example:
views:
    # View tab title.
  - title: Example
    # Unique path for direct access /lovelace/${path}
    path: example
    # Each view can have a different theme applied. Theme should be defined in the frontend.
    theme: dark-mode
    # The cards to show on this view.
    cards:
        # The filter card will filter entities for their state
      - type: entity-filter
        entities:
          - device_tracker.paulus
          - device_tracker.anne_there
        state_filter:
          - 'home'
        card:
          type: glance
          title: People that are home

        # The picture entity card will represent an entity with a picture
      - type: picture-entity
        image: https://www.home-assistant.io/images/default-social.png
        entity: light.bed_light

    # Specify a tab icon if you want the view tab to be an icon.
  - icon: mdi:home-assistant
    # Title of the view. Will be used as the tooltip for tab icon
    title: Second view
    cards:
        # Entities card will take a list of entities and show their state.
      - type: entities
        # Title of the entities card
        title: Example
        # The entities here will be shown in the same order as specified.
        # Each entry is an entity ID or a map with extra options.
        entities:
          - light.kitchen
          - switch.ac
          - entity: light.living_room
            # Override the name to use
            name: LR Lights

        # The markdown card will render markdown text.
      - type: markdown
        title: Dashboard
        content: >
          Welcome to your **dashboard**.