Energy cards
This is a list of all the cards and badges used in the energy dashboard. You can also place them anywhere you want in your dashboard.
You can add these cards using the visual card editor or by editing the YAML directly. In the visual editor, these are located in the Energy cards section of the card picker dialog.
You can configure them on the energy configuration page.
Energy date picker
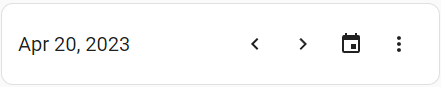 Screenshot of the Energy date selection card.
This card allows you to pick what data to show. Changing it in this card will influence the data in all other cards. Specific dates and ranges can be selected by opening the date range picker. The current period can be compared to the previous one using the compare data option within the menu.
YAML configuration
The following YAML options are available:
Configuration Variables
Collection key to use for the card. This links the card to a specific energy dashboard collection. If not provided, defaults to the current dashboard page URL.
up, down or auto. Determines the vertical direction to open the date range picker. auto changes it based on the screen size.
left, right, center or auto. Determines the horizontal direction to open the date range picker. auto changes it based on the screen size.
Example
type: energy-date-selection
Energy compare alert
 Screenshot of the energy compare alert card.
This card shows which date ranges are being compared, and provides the option to switch between different compare modes.
The card is only visible when comparing data periods, otherwise it will be hidden.
YAML configuration
The following YAML options are available:
Example
type: energy-compare-card
Energy usage graph
 Screenshot of the Energy usage graph card.
The energy usage graph card shows the amount of energy your house has consumed, and from what source this energy came. It will also show the amount of energy your have returned to the grid.
YAML configuration
The following YAML options are available:
Configuration Variables
Collection key to use for the card. This links the card to a specific energy dashboard collection. If not provided, defaults to the current dashboard page URL.
Example
type: energy-usage-graph
Solar production graph
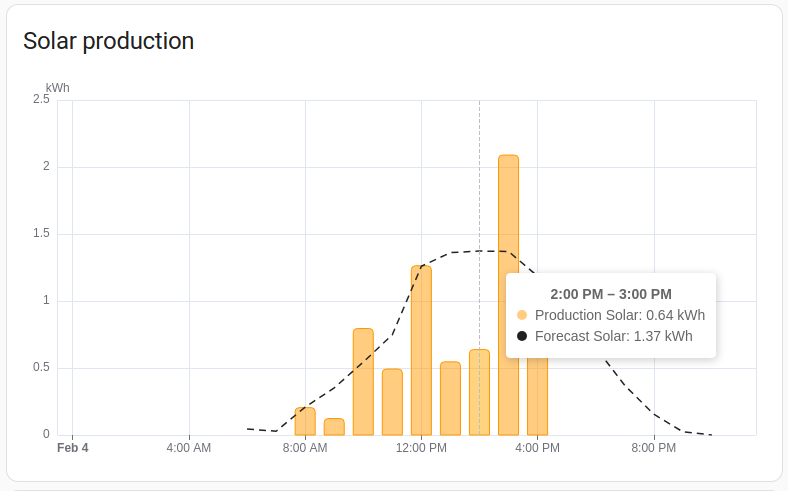 Screenshot of the Solar production graph card.
The solar production graph card shows the amount of energy your solar panels have produced per source, and if setup and available the forecast of the solar production.
YAML configuration
The following YAML options are available:
Configuration Variables
Collection key to use for the card. This links the card to a specific energy dashboard collection. If not provided, defaults to the current dashboard page URL.
Example
type: energy-solar-graph
Gas consumption graph
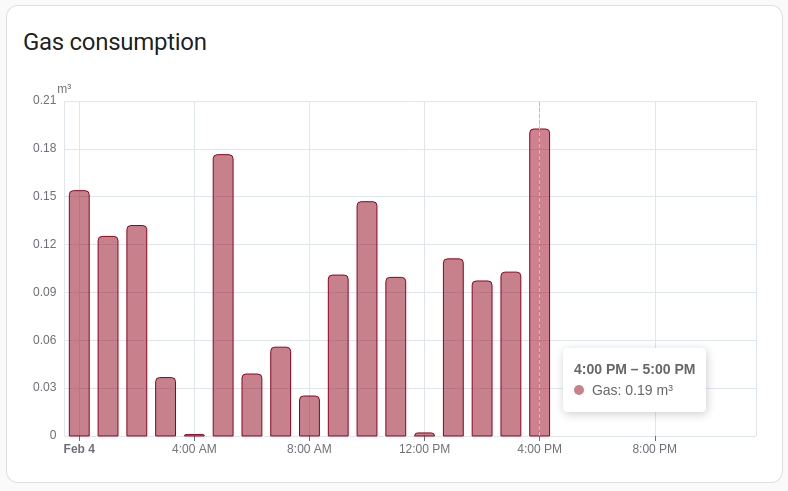 Screenshot of the gas consumption graph card.
The gas consumption graph card shows the amount of gas consumed per source.
YAML configuration
The following YAML options are available:
Configuration Variables
Collection key to use for the card. This links the card to a specific energy dashboard collection. If not provided, defaults to the current dashboard page URL.
Example
type: energy-gas-graph
Water consumption graph
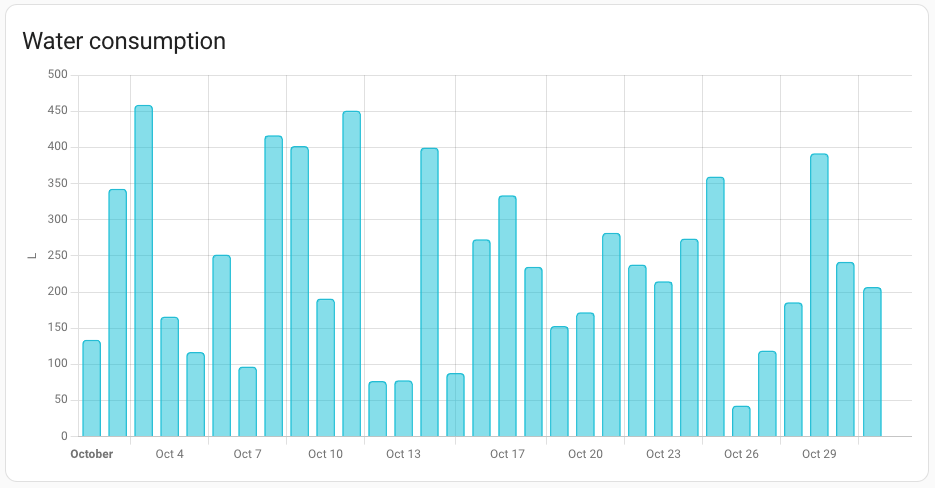 Screenshot of the water consumption graph card.
The water consumption graph card shows the amount of water consumed per source.
YAML configuration
The following YAML options are available:
Configuration Variables
Collection key to use for the card. This links the card to a specific energy dashboard collection. If not provided, defaults to the current dashboard page URL.
Example
type: energy-water-graph
Water Sankey graph
 Screenshot of the water sankey graph card.
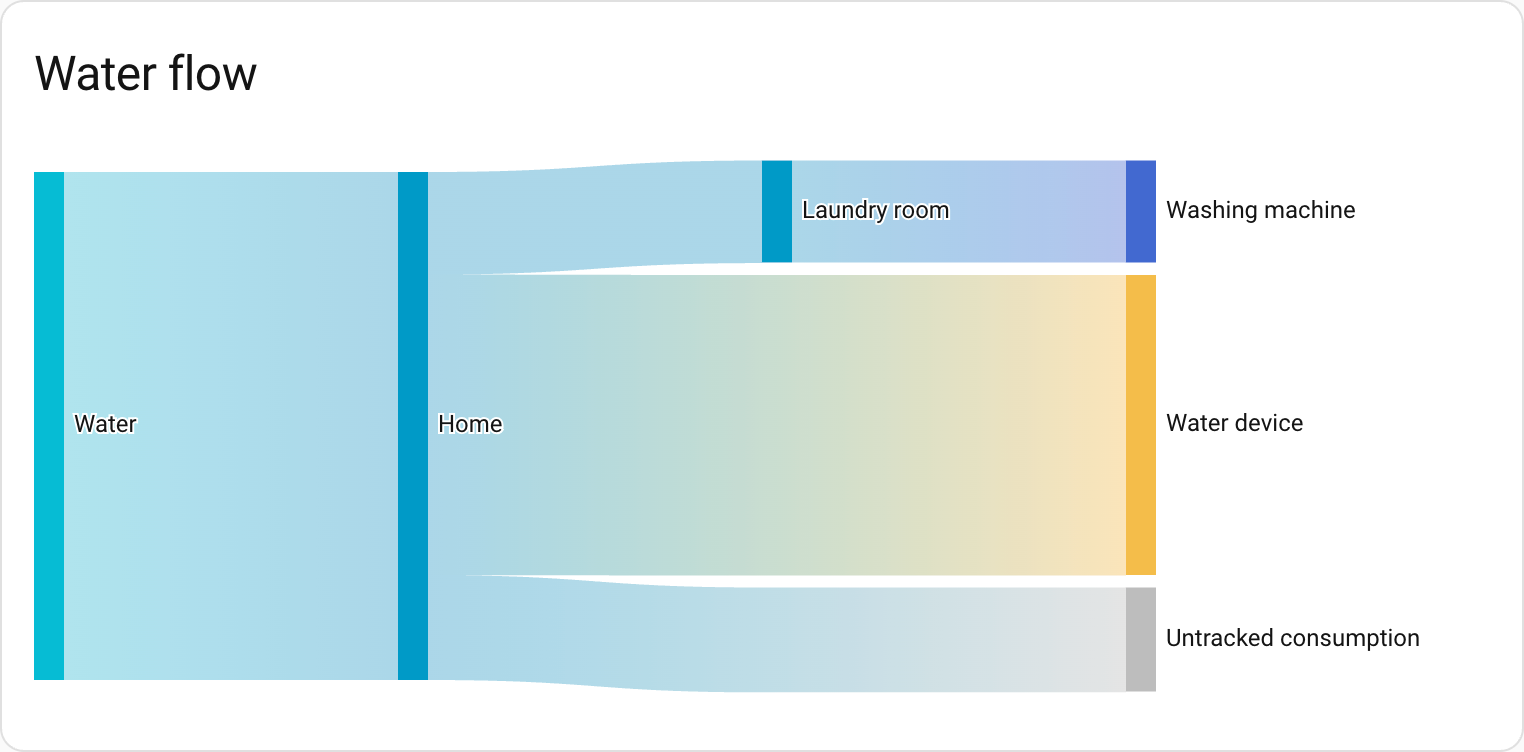
The water Sankey graph shows the flow of water consumption in your home. It visualizes how water flows from sources to the various consumers. Devices are grouped into floors and areas if these are configured.
This card displays historical water data based on the selected date range from the energy date picker.
YAML configuration
The following YAML options are available:
Configuration Variables
Collection key to use for the card. This links the card to a specific energy dashboard collection. If not provided, defaults to the current dashboard page URL.
vertical, horizontal or auto. Determines the orientation (flow direction) of the card. auto changes it based on the screen size.
Examples
type: water-sankey
The following example orients the flow from left to right:
type: water-sankey
layout: horizontal
Energy distribution
 Screenshot of the Energy distribution card.
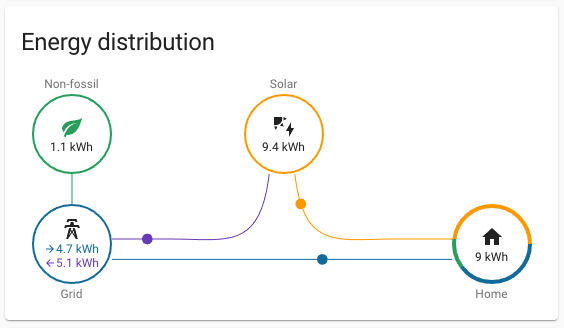
The energy distribution card shows how the energy flowed, from the grid to your house, from your solar panels to your house and/or back to the grid.
If setup, it will also tell you how many kWh of the energy you got from the grid was produced without using fossil fuels.
YAML configuration
The following YAML options are available:
Configuration Variables
Collection key to use for the card. This links the card to a specific energy dashboard collection. If not provided, defaults to the current dashboard page URL.
Example
type: energy-distribution
link_dashboard: true
Energy sources table
 Screenshot of the Energy sources table card.
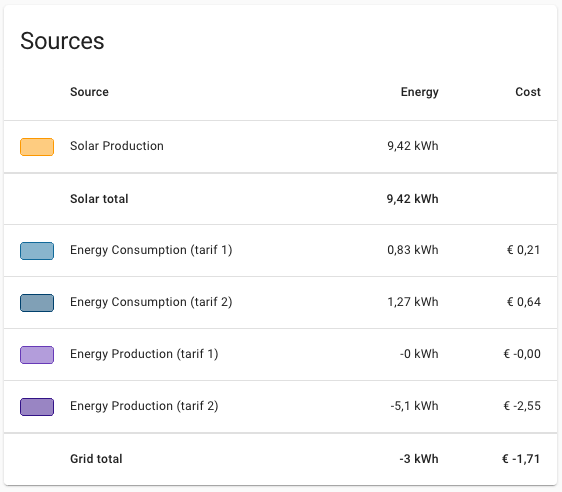
The energy sources table card shows all your energy sources, and the corresponding amount of energy. If setup, it will also show the costs and compensation per source and the total.
YAML configuration
The following YAML options are available:
Configuration Variables
If defined, table displays listed types of consumption only. Valid values are: grid, solar, battery, gas, and water.
Example
type: energy-sources-table
types:
  - gas
  - water
Grid neutrality gauge
 Screenshot of the Grid neutrality gauge card.
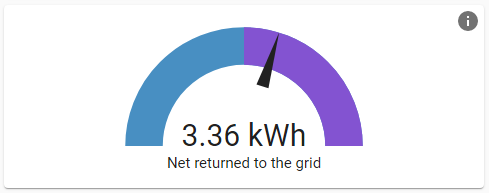
The grid neutrality gauge card represents your energy dependency. If the needle is in the purple, you returned more energy to the grid than you consumed from it. If it’s in the blue, you consumed more energy from the grid than you returned.
Example
type: energy-grid-neutrality-gauge
Grid energy balance
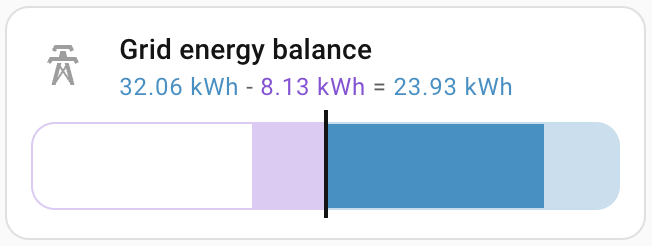 Screenshot of the Grid energy balance card.
The grid energy balance card shows your net grid energy as an equation: imported energy minus exported energy. A positive value means you imported more energy from the grid than you exported. A negative value means you exported more energy to the grid than you imported. It includes a visual bar gauge that represents the ratio between imported and exported energy, with the bar filling from a center line toward the dominant direction.
Example
type: energy-grid-balance
Solar consumed gauge
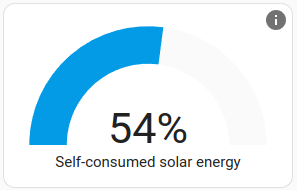 Screenshot of the Solar consumed gauge card.
The solar consumed gauge represents how much of the solar energy was used by your home and was not returned to the grid. If you frequently return a lot, try to conserve this energy by installing a battery or buying an electric car to charge.
Example
type: energy-solar-consumed-gauge
Carbon consumed gauge
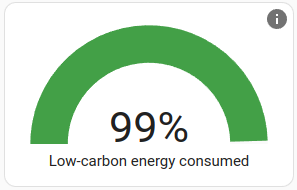 Screenshot of the Carbon consumed gauge card.
The carbon consumed gauge card represents how much of the energy consumed by your home was generated using non-fossil fuels like solar, wind and nuclear. It includes the solar energy you generated your self.
Example
type: energy-carbon-consumed-gauge
Self-sufficiency gauge
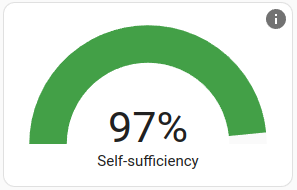 Screenshot of the self-sufficiency gauge card.
The self-sufficiency gauge represents how self-sufficient your home is. If you rely on grid imports, this value decreases. You can increase this value by adding more solar capacity or battery storage.
Example
type: energy-self-sufficiency-gauge
Devices energy graph
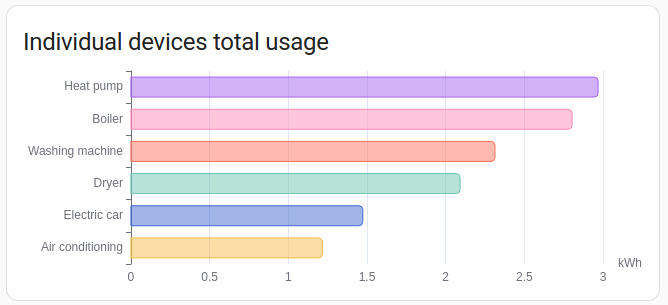 Screenshot of the devices energy graph card.
The devices energy graph shows the energy usage per device. It is sorted by usage.
YAML configuration
The following YAML options are available:
Configuration Variables
By default, this card will show all your devices. Optionally, the number of devices can be limited by adding the max_devices option and specifying the maximum number of devices to show. If there are more devices available than shown, the devices with the highest energy usage are shown.
Examples
type: energy-devices-graph
The following example limits the number of shown devices to 5:
type: energy-devices-graph
max_devices: 5
Detail devices energy graph
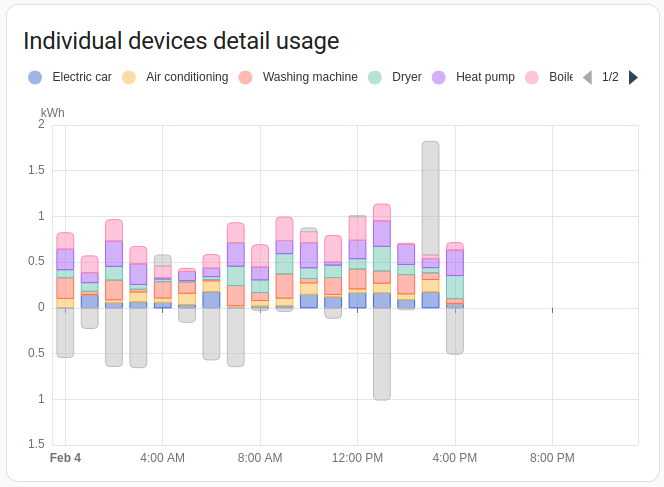 Screenshot of the detail devices energy graph card.
The Detail devices energy graph card is similar to the Devices energy graph card, but shows the individual usage on a time scale.
By default, this card will show all your devices. Optionally, the number of devices can be limited by adding the max_devices option and specifying the maximum number of devices to show. If there are more devices available than shown, the devices with the highest energy usage are shown.
Examples
type: energy-devices-detail-graph
The following example limits the number of shown devices to 5:
type: energy-devices-detail-graph
max_devices: 5
Sankey energy graph
 Screenshot of the sankey energy graph card.
The sankey energy graph shows the flow of energy in your home. It starts with sources and flows into the various consumers. Devices are grouped into floors and areas if these are configured.
YAML configuration
The following YAML options are available:
Configuration Variables
vertical, horizontal or auto. Determines the orientation (flow direction) of the card. auto changes it based on the screen size.
Examples
type: energy-sankey
The following example orients the flow from top to bottom:
type: energy-sankey
layout: vertical
Power flow Sankey graph
Screenshot of the power Sankey graph card.
The power Sankey graph shows the real-time flow of power in your home. Unlike the energy Sankey card, which shows historical energy data based on the selected date range, this card displays current power values and is not affected by the date picker selection.
It visualizes the instantaneous power flow from sources (like the grid, solar panels, and battery) to consumers in your home. Devices are grouped into floors and areas if these are configured.
YAML configuration
The following YAML options are available:
Configuration Variables
Collection key to use for the card. This links the card to a specific energy dashboard collection. If not provided, defaults to the current dashboard page URL.
vertical, horizontal or auto. Determines the orientation (flow direction) of the card. auto changes it based on the screen size.
Examples
type: power-sankey
The following example orients the flow from left to right:
type: power-sankey
layout: horizontal
Power sources graph
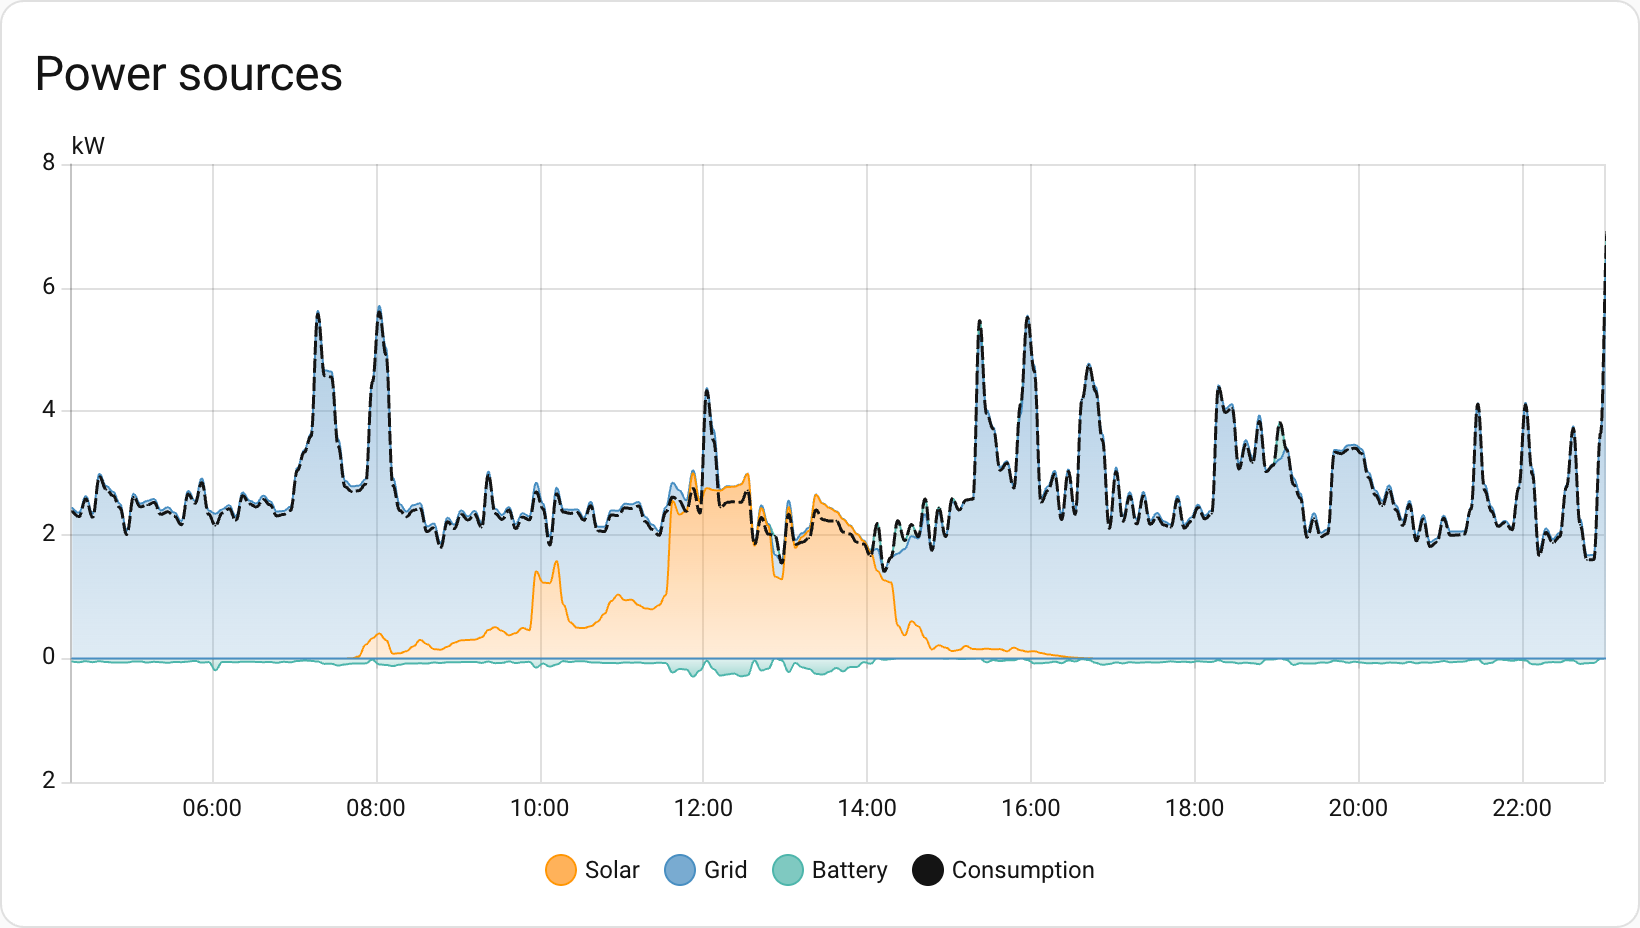 Screenshot of the power Sankey graph card.
The power sources graph shows historical power data.
YAML configuration
The following YAML options are available:
Configuration Variables
Collection key to use for the card. This links the card to a specific energy dashboard collection. If not provided, defaults to the current dashboard page URL.
Examples
type: power-sources-graph
Power consumption badge
![]() Screenshot of the power consumption badge.
Screenshot of the power consumption badge.
The power consumption badge displays the current total power consumption of your home. It calculates the total power by combining grid import, solar, and battery sources.
YAML configuration
Example
type: power-total
Gas flow rate badge
![]() Screenshot of the gas flow rate badge.
Screenshot of the gas flow rate badge.
The gas flow rate badge displays the current total gas flow rate from all configured gas sources.
YAML configuration
Example
type: gas-total
Water flow rate badge
![]() Screenshot of the water flow rate badge.
Screenshot of the water flow rate badge.
The water flow rate badge displays the current total water flow rate from all configured water sources.
YAML configuration
Example
type: water-total
Using multiple collections
By default, all energy cards on the current dashboard are linked together. Any energy-date-selection cards on this dashboard control what data is shown. If there are none, a default date of today is used. When you add multiple date selection cards, they always show the same date. Any energy-date-selection card on a different dashboard does not affect energy cards on the current dashboard.
To enable multiple different date selections on the same dashboard, they must be linked to different collections. This is done using the collection_key parameter, either in the visual editor or in the card YAML, with a value of any custom string that begins with energy_ (strings that do not start with energy_ will generate an error).
All energy cards support use of collection_key option.
Examples
Example view with multiple collections:
type: masonry
path: example
cards:
  - type: energy-date-selection
  - type: energy-date-selection
    collection_key: energy_2

  # This card is linked to the first (default) date selection
  - type: energy-usage-graph

  # This card is linked to the second date selection
  - type: energy-usage-graph
    collection_key: energy_2