Statistics graph card
The statistics graph card allows you to display a graph of statistics data for each of the entities listed.
 Screenshot of the statistics graph card with no metered entities and `chart_type` `line`.
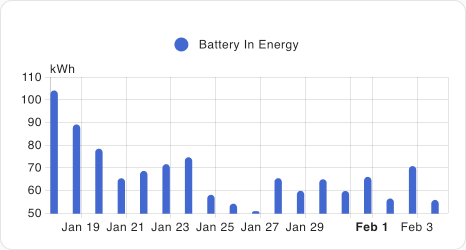 Screenshot of the statistics graph card with a metered entity and `chart_type` `bar`.
Statistics are gathered every 5 minutes and also hourly for sensors with a state_class of measurement, total or total_increasing. The 5-minute statistics will be retained for the duration set in the recorder configuration, and hourly statistics will be retained indefinitely. It will either keep the min, max, and mean of a sensor’s value for a specific hour or the sum for a metered entity.
If your sensor doesn’t work with statistics, check this.
To add the statistics graph card to your user interface:
- In the top right of the screen, select the edit
button. - If this is your first time editing a dashboard, the Edit dashboard dialog appears.
- By editing the dashboard, you are taking over control of this dashboard.
- This means that it is no longer automatically updated when new dashboard elements become available.
- Once you’ve taken control, you can’t get this specific dashboard back to update automatically. However, you can create a new default dashboard.
- To continue, in the dialog, select the three dots
menu, then select Take control.
- If this is your first time editing a dashboard, the Edit dashboard dialog appears.
- Add a card and customize actions and features to your dashboard.
All options for this card can be configured via the user interface.
YAML configuration
The following YAML options are available when you use YAML mode or just prefer to use YAML in the code editor in the UI.
Configuration Variables
A list of entity IDs or entity objects (see below), or an external statistic id
The period of the rendered graph. 5minute, hour, day, week, month or year. If energy_date_selection is true, and period is not defined, the chart period will auto-select between month/day/hour based on the selected date range.
If true, numerical values on the Y-axis will be displayed with a logarithmic scale.
If true, configured Y-axis bounds would automatically extend (but not shrink) to fit the data.
If true, chart date range will follow the date selected on an energy-date-selection card on the same view, similar to energy cards.
Options for entities
If you define entities as objects instead of strings, you can add more customization and configuration:
Configuration Variables
Overwrites friendly name. Can be a string, or a name configuration object. See naming documentation.
Example
type: statistics-graph
title: 'My Graph'
entities:
  - sensor.outside_temperature
  - entity: sensor.inside_temperature
    name: Inside