Setting up InfluxDB and Grafana using Docker
Home Assistant collects volumes of (time series) data that are well suited for some fancy graphs. Although the History component provides some nice plots, I am sure you have always wanted those fancy Grafana plots. The problem, however, is that low-powered device such as Raspberry Pi that most of us use for our Home Assistant setup are not well suited for such operation.
Instead of running InfluxDB and Grafana on a Raspberry Pi or a different system and go through the classic approach of installing both tools separately, you can run them in a Docker container on another machine. For this tutorial, I am using a Synology NAS, but the instructions should apply to other devices that can run Docker. Just follow the steps below:
- SSH into your NAS. You may have to run
sudo suif you are getting permission errors. - Download the docker-statsd-influxdb-grafana image using the command:
docker pull samuelebistoletti/docker-statsd-influxdb-grafana - To start the container for the first-time launch:
docker run -d \ --name docker-statsd-influxdb-grafana \ -p 3003:3003 \ -p 3004:8083 \ -p 8086:8086 \ -p 22022:22 \ -p 8125:8125/udp \ samuelebistoletti/docker-statsd-influxdb-grafana:latest - The image should now be running and both InfluxBD and Grafana should be now up and running.
- You can access InfluxDB at http://NAS_IP_ADDRESS:3004/ and Grafana at http://NAS_IP_ADDRESS:3003/
- Navigate to http://NAS_IP_ADDRESS:3004/ and create the database
home_assistantusing the commandCREATE DATABASE home_assistant.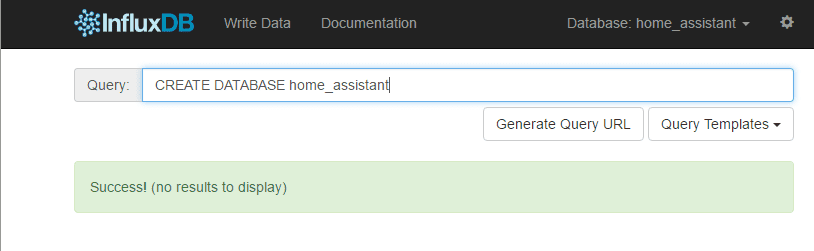
- Now, you need to configure Home Assistant to use InfluxDB. Since, we did not add any username/password to our database, we can simply add the following to our configuration.yaml (replace the IP address with that of the device running Docker) and restart Home Assistant to setup InfluxDB (you will have to fine tune it based on your preferences):
influxdb: host: 192.168.2.113 - Next, we need to configure Grafana to use InfluxDB. Navigate to http://NAS_IP_ADDRESS:3003/ to access Grafana (login with username and password
root) and add your first data source. Here’s how you can configure Grafana to use InfluxDB database. Note that 192.168.2.113 is the IP address of my NAS.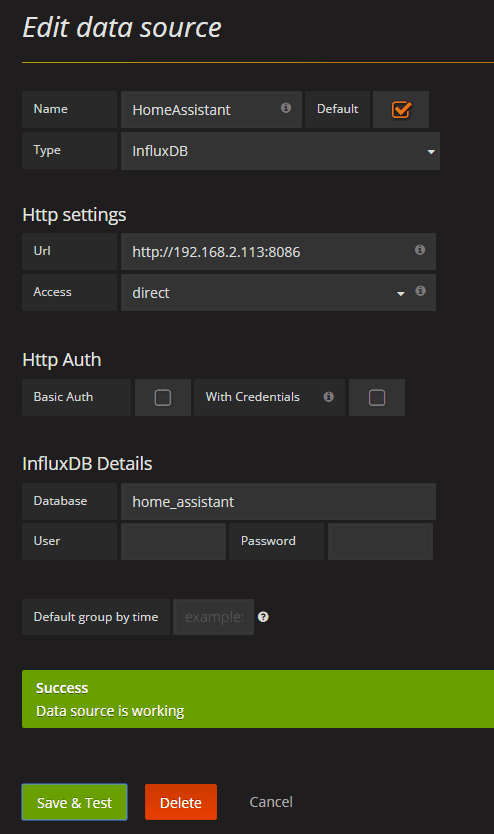
- You should see
Data source is workingif you have configured everything correctly. - With all that configured, you are now ready for the fun stuff. You can create as many dashboards as you want and then import the same in Home Assistant.
- To add the Grafana dashboard in HA, use the following config:
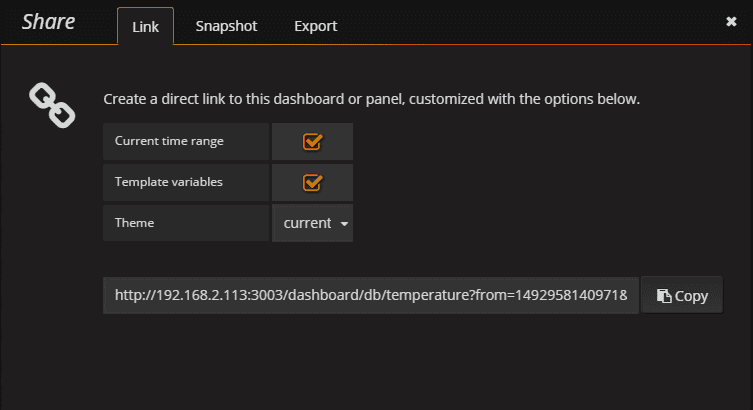
The URL can be obtained by clicking Share Dashboard link on your dashboard:
panel_iframe:
  router:
    title: "Temperature"
    url: "http://192.168.2.113:3003/dashboard/db/temperature?edit&tab=time%20range"