Netdata
The Netdata integrationIntegrations connect and integrate Home Assistant with your devices, services, and more. [Learn more] allows you to display information collected by Netdata.
Prerequisites
A running Netdata instance, accessible from your Home Assistant instance. For more information on setting up Netdata, check out their documentation.
Setup
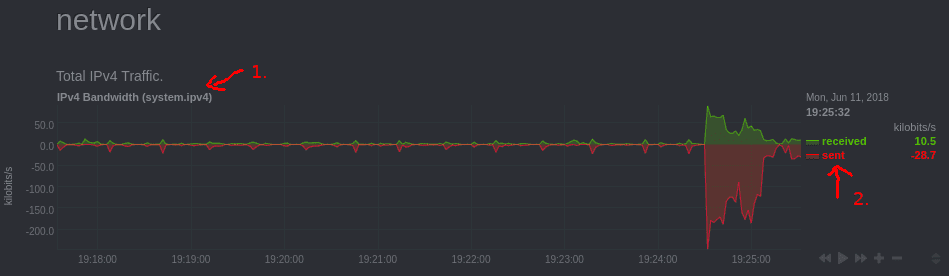
Getting the details to configure the sensors is a bit tricky as Netdata uses different name for the element: value that is required. To get the value for the data_group: use Netdata’s web interface. 1. marks the name for the data_group:. 2. are the names for the element to show in Home Assistant. The name that is shown can be different than the name under which the metrics are available.
To check if the element: name matches the name in the Netdata frontend, use curl with the IP address of your Netdata instance, its port and the data_group:
$ curl -X GET "http://[Netdata_Instance]:19999/api/v1/data?chart=[data_group]&points=2&options=jsonwrap"
{
   "api": 1,
   "id": "system.ipv4",
   "name": "system.ipv4",
[...]
   "dimension_names": ["received", "sent"],
   "dimension_ids": ["InOctets", "OutOctets"],
[...]
-
dimension_names: Names shown in the frontend. -
dimension_ids: Names to use forelement.
Alternatively you can browse to the built in Netdata API in your browser http://[Netdata_Instance]:19999/api/v1/allmetrics?format=json and search for the data_group identified in the Netdata frontend. In the example JSON below the data group is “system.load”.
	"system.load": {
		"name":"system.load",
		"context":"system.load",
		"units":"load",
		"last_updated": 1558446920,
		"dimensions": {
			"load1": {
				"name": "load1",
				"value": 0.1250000
			},
			"load5": {
				"name": "load5",
				"value": 0.1290000
			},
			"load15": {
				"name": "load15",
				"value": 0.1430000
			}
		}
	},
Once the data_group “system.load” and the element “load15” have been identified from the JSON it can be configured in your configuration.yamlThe configuration.yaml file is the main configuration file for Home Assistant. It lists the integrations to be loaded and their specific configurations. In some cases, the configuration needs to be edited manually directly in the configuration.yaml file. Most integrations can be configured in the UI. [Learn more] file.
After changing the configuration.yamlThe configuration.yaml file is the main configuration file for Home Assistant. It lists the integrations to be loaded and their specific configurations. In some cases, the configuration needs to be edited manually directly in the configuration.yaml file. Most integrations can be configured in the UI. [Learn more] file, restart Home Assistant to apply the changes. The integration is now shown on the integrations page under Settings > Devices & services. Its entities are listed on the integration card itself and on the Entities tab.
Configuration
Add the following to your configuration.yamlThe configuration.yaml file is the main configuration file for Home Assistant. It lists the integrations to be loaded and their specific configurations. In some cases, the configuration needs to be edited manually directly in the configuration.yaml file. Most integrations can be configured in the UI. [Learn more].
# Example configuration.yaml entry
sensor:
  - platform: netdata
    resources:
      load:
        data_group: system.load
        element: load15
Configuration Variables
List of details to monitor.
Name to use for the sensor in the frontend.
Icon to use for the sensor.
Full example
# Example configuration.yaml entry
sensor:
  - platform: netdata
    host: "192.168.1.2"
    port: "19999"
    name: SomeHostName
    resources:
      system_load:
        data_group: system.load
        element: load15
      core0_freq:
        data_group: "cpu.cpufreq"
        element: "cpu0"
        icon: mdi:chip